Spyrogram Art
Two Planets
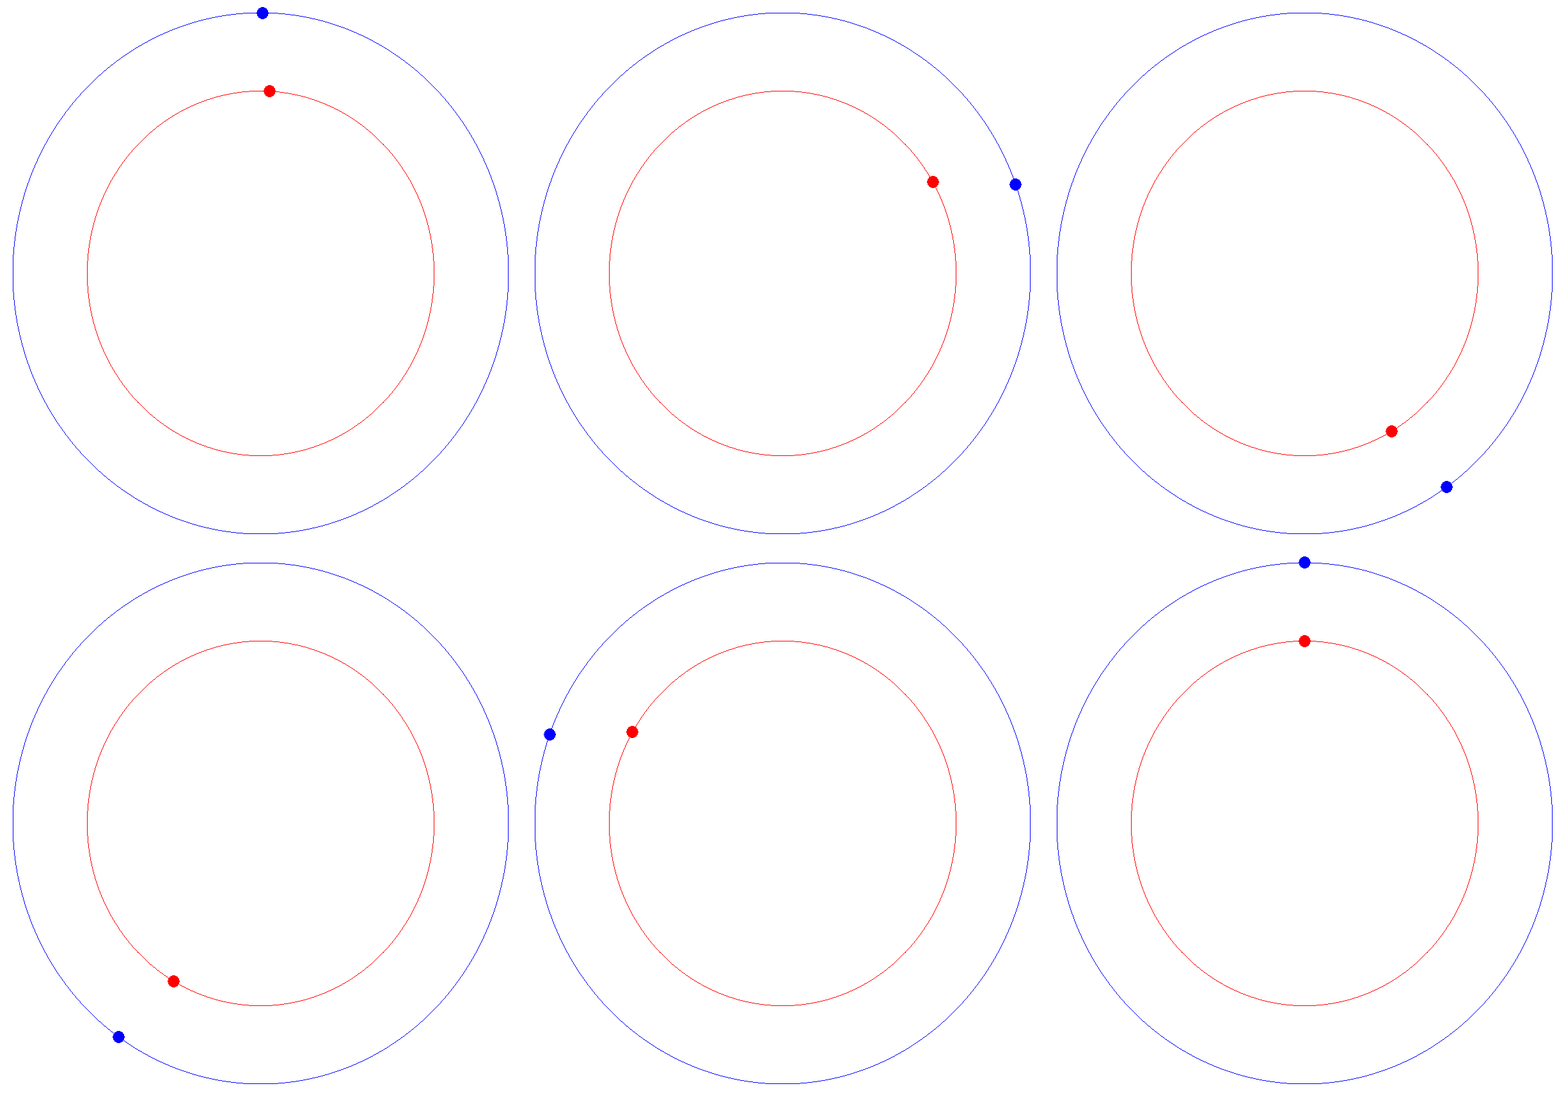
Consider a circle. In 2D, you can plot a circle by setting x1=cosine(angle) and y1=sine(angle), as you let angle go from 0 to 360 degrees. Let's say this is the orbit of a planet.
Now let's say there's a second planet rotating around the same sun, but it's closer and its orbital time is much faster. We can represent this by saying x2= 0.9*cosine(6*angle) and y2 = 0.9*sine(6*angle), as angle goes from 0 to 360 degrees.
Here's a video of the two 'planets' rotating past each other.
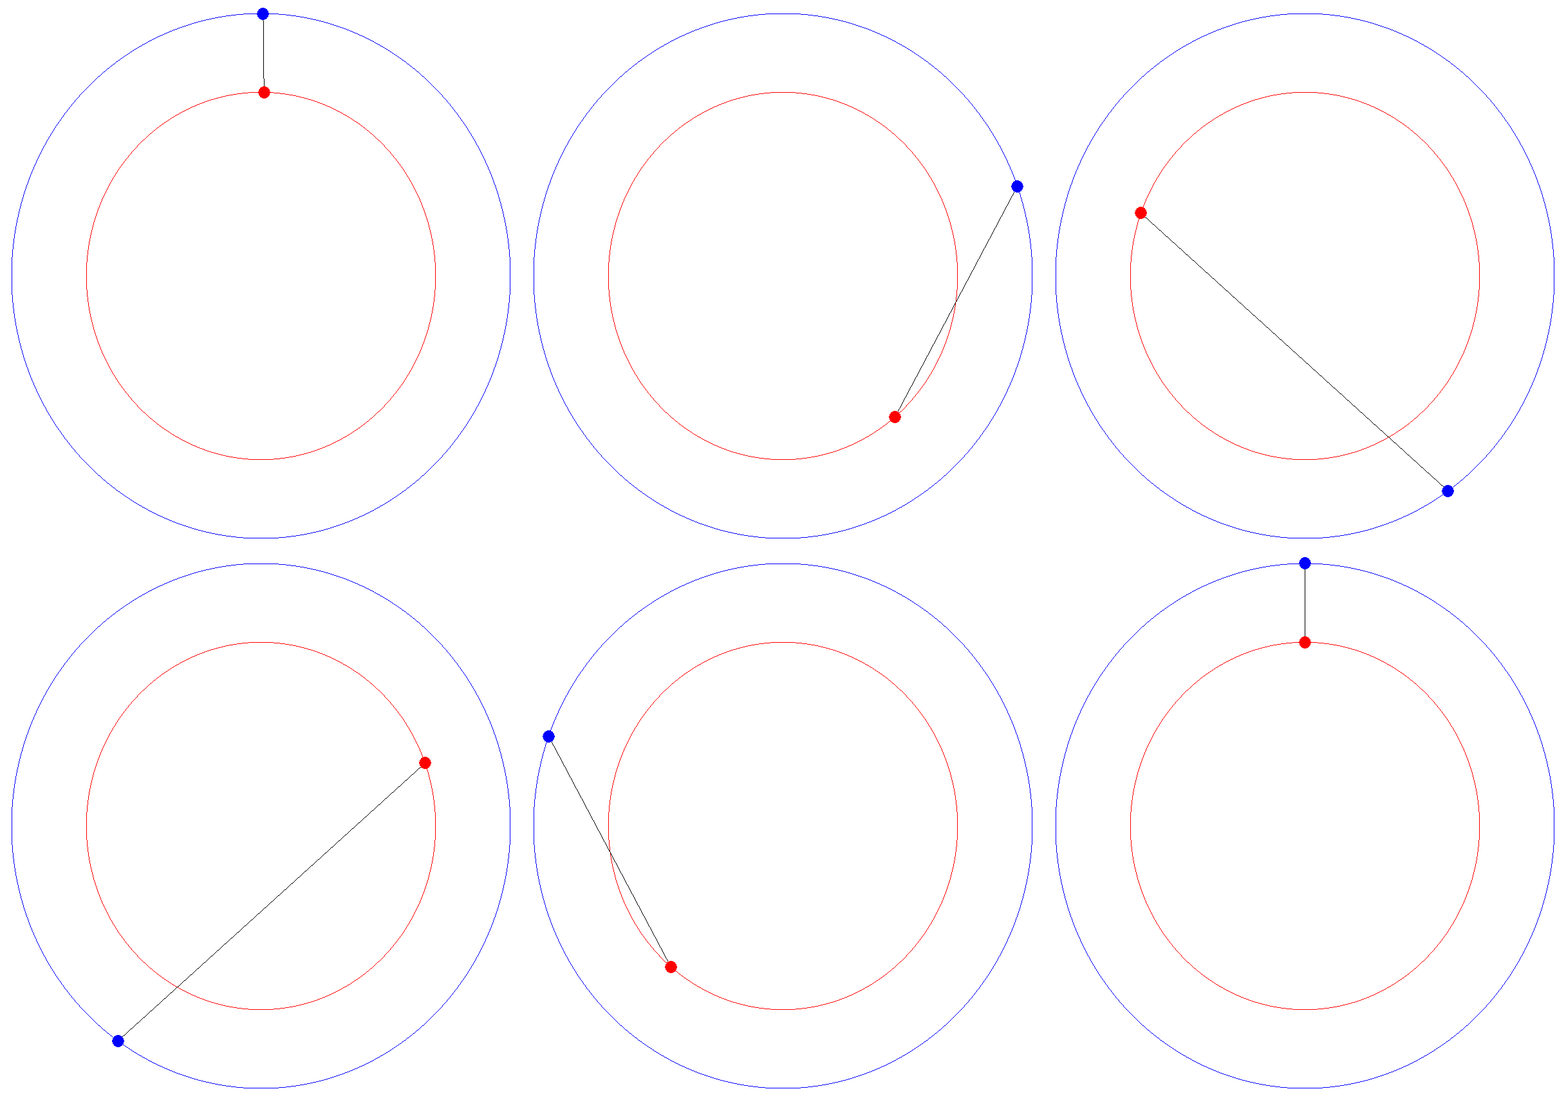
This is all well and good, but where does the art come in? Well, let's say we draw a line between the two orbiting planets for each angle increment (say, 0.5 degrees).
With this simple program, we can generate an image that looks like this!

Here's the relevant MATLAB code:
% Create a 1000x1000 figure
fig1=figure('Position',[10,10,1000,1000],'Color',[1,1,1]);
scale=.7;
speedScale=6;
% Specify the basic plot parameters
plot(0,0);
xlim([-1.5,1.5]);
ylim([-1.5,1.5]);
axis off
hold on
% Draw the image
for i=0.5:.5:360 % For cyclical functions, you'll want to iterate across a
% full circle, which is 360 degrees.
% For these four lines, choose any trigonometric functions you like
xt=sind(i);
yt=cosd(i);
xt2=scale*sind(speedScale*i);
yt2=scale*cosd(speedScale*i);
% Plot each line of the drawing
p=plot([xt,xt2],[yt,yt2],'Color',[0 0 0]);
p.Color(4)=0.2; % this makes the drawing semi-transparent
end
Feel free to play around with this- what does the image look like if you change the relative radii of the two planets? What if you change the relative speed of the two planets? I've included a couple examples below.

Now let's take this one step further- away from reality and into the realm of geometric art. We can set x and y to be anything! Who says we need to have a circle? Try playing around with the parameters and seeing what kind of art you can create!
Remember, in Matlab, the commands for the trigonometric functions are as follows (for degrees, not radians):
Sine : sind()
Cosine : cosd()
Tangent : tand()
Arcsine : asind()
Arccosine : acosd()
Arctangent : atand()


Three Planets
Now let's return to our original example and add a third planet to the mix! First, let's look at the planets orbiting around a center point and draw lines between planets 1 and 2, and between planets 2 and 3.
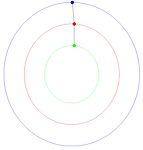
Finally, let's remove the planet circles and keep all the previous lines we've drawn.

Here's the relevant MATLAB code:
% Create a 1000x1000 figure
fig1=figure('Position',[10,10,1000,1000], 'Color',[1,1,1]);
scale1=.7;
scale2=.4;
speedScale1=6;
speedScale2=10;
% Specify the basic plot parameters
plot(0,0);
xlim([-1.5,1.5]);
ylim([-1.5,1.5]);
axis off
hold on
% Draw the image
for i=0.5:.5:360 % For cyclical functions, you'll want to iterate across a
% full circle, which is 360 degrees.
% For these four lines, choose any trigonometric functions you like
xt=sind(i);
yt=cosd(i);
xt2=scale1*sind(speedScale1*i);
yt2=scale1*cosd(speedScale1*i);
xt3=scale2*sind(speedScale2*i);
yt3=scale2*cosd(speedScale2*i);
% Plot each line of the drawing
p=plot([xt,xt2],[yt,yt2],'Color',[0 0 0]);
p1=plot([xt2,xt3],[yt2,yt3],'Color',[0,0,0]);
% this makes the drawing semi-transparent
p.Color(4)=0.1;
p1.Color(4)=0.1;
pause(.001);
end
We can create some interesting images just by varying the relative scales and speeds of the planets:

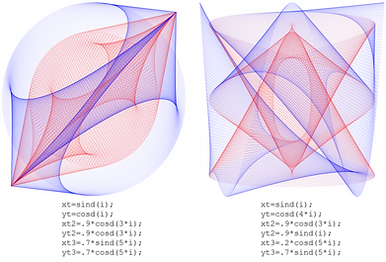
Now let's add trigonometric variation to this as well! Here are some examples:
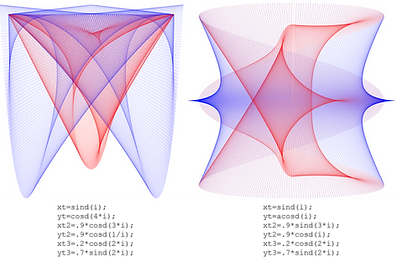
So, the pause function is nice- it allows you to see your design develop. But how do you capture that process in a video format? Turns out, it's pretty easy in Matlab!
Basically, it works like this. You create something called a writer object (writerObj) that is going to make your video. You tell it things like what to name your video, what the framerate should be, and what the quality should be. Then you open this object. Every time you want to add a frame to your video (so, every loop iteration), you 'capture' the current state of the figure using the getframe command. You then write that frame onto the writer object. Finally, when you're done you close the writer object. (This is an important step; your video won't play if you don't close the writer object.)
Put this code at the beginning of your script:
writerObj = VideoWriter('3planetsDemo.avi'); % Name it.
writerObj.FrameRate = 100;
writerObj.Quality=100;
open(writerObj)
Then include this script every time your figure updates:
frame = getframe(1); writeVideo(writerObj, frame)
Finally, remember to include this line at the end to close the writer object:
close(writerObj)
Four Planets
Here's an example with four planets!