Random Walk
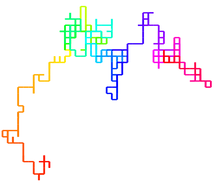
"Random walk" is a phrase used to describe a particular mathematical method of moving. Let's say you start at a point on a two-dimensional grid. You have four options: you can go left, right, forward, or backwards. But you can only move by a single step (let's call it distance 1). You must choose your direction randomly from among those four options. Once you have moved, you perform the process all over again. If you continue moving in this pseudo-random way, your path forms an interesting pattern, and has complex mathematical properties that I won't go into here.

2D Random Walk
% 2D Random Walk
% Set the number of iterations
iterations=500;
% Pre-allocate the random walk vector
% The two rows hold the x and y positions at each time step
rwPath=zeros(2,iterations);
for i=2:iterations
% Calculate a random direction between 1 and 4
dir=ceil(rand*4);
rwPath(:,i)=rwPath(:,i-1);
if dir==1
rwPath(1,i)=rwPath(1,i)+1;
elseif dir==2
rwPath(1,i)=rwPath(1,i)-1;
elseif dir==3
rwPath(2,i)=rwPath(2,i)+1;
elseif dir==4
rwPath(2,i)=rwPath(2,i)-1;
end
end
% Generate the figure
f=figure('Position',[50,50,700,700],'Color',[1 1 1]);
temp=(hsv(size(rwPath,2)));
min1=min(rwPath(1,:));
min2=min(rwPath(2,:));
max1=max(rwPath(1,:));
max2=max(rwPath(2,:));
for i=2:size(rwPath,2)
x=rwPath(1,i-1:i);
y=rwPath(2,i-1:i);
S = plot(x,y,'LineWidth',3,'Color',temp(i,:));
axis off
hold on
xlim([min1,max1])
ylim([min2,max2])
end


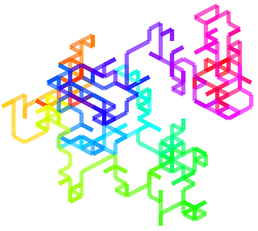
3D Random Walk
Now we're ready to try this in three dimensions! The concept is identical- we just add an extra dimension of possible movement (the z-axis). If you grew up around the time I did, you might recognize a similarity with a certain screensaver consisting of random pipes. Which might possibly have been my inspiration for this coloring scheme!


% 3D Random Walk
% Set the number of iterations
iterations=500;
% Pre-allocate the random walk vector
% The three rows hold the x, y, and z positions at each time step
rwPath=zeros(3,iterations);
for i=2:iterations
% Calculate a random direction between 1 and 6
dir=ceil(rand*6);
% Change the appropriate direction part of the vector
rwPath(:,i)=rwPath(:,i-1);
if dir==1
rwPath(1,i)=rwPath(1,i)+1;
elseif dir==2
rwPath(1,i)=rwPath(1,i)-1;
elseif dir==3
rwPath(2,i)=rwPath(2,i)+1;
elseif dir==4
rwPath(2,i)=rwPath(2,i)-1;
elseif dir==5
rwPath(3,i)=rwPath(3,i)+1;
elseif dir==6
rwPath(3,i)=rwPath(3,i)-1;
end
end
% Generate the figure
f=figure('Position',[50,50,900,900],'Color',[1 1 1]);
temp=(hsv(size(rwPath,2)));
for i=2:size(rwPath,2)
x=rwPath(1,i-1:i);
y=rwPath(2,i-1:i);
z=rwPath(3,i-1:i);
S = surface([x;x],[y;y],[z;z],...
'facecol','no',...
'edgecol','interp',...
'linew',3,...
'edgealpha',.4,...
'edgecolor',temp(i,:));
axis off
xlim([min(rwPath(1,:)) max(rwPath(1,:))])
ylim([min(rwPath(2,:)) max(rwPath(2,:))])
zlim([min(rwPath(3,:)) max(rwPath(3,:))])
hold on
view([1 1 1])
end