Levy C Curve
The Basic Formula
The Levy C Curve and Dragon Curve are variations on the same idea. You start with a line and essentially “fold” that line in a repetitive way to achieve the final pattern. More mathematically speaking, you replace each existing line segment with two lines that would form a 45-45-90 triangle with the existing line segment, as shown below.


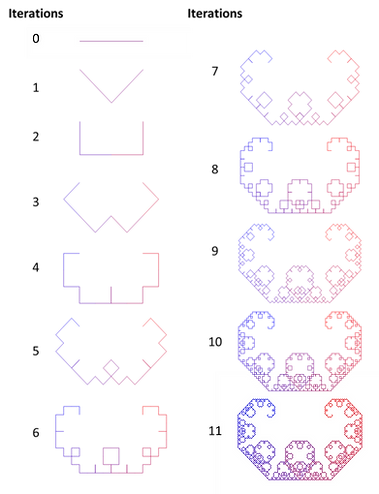
After that first iteration, you should have two lines (as depicted above). You then repeat the process, folding each of those two lines into two more lines. You continue on in this fashion until you have achieved the desired level of resolution.
You repeat this pattern of “folding” the line and the resulting fractal is called the Levy C curve. Below, you can see the first 11 iterations of the fractal!
The Basic Code (and how to use it)
You may have noticed the the phrase preceding the image at the beginning of this section: Folding_Curve(16,0,[-1,1],[-1,1],[0]). This demonstrates how to call the Matlab function that will generate the image of the Levy C Curve. The function name is "Folding_Curve," and the items in the parentheses are the inputs to that function. The image here describes what the various inputs do. You can follow the link below to the function itself. To run the code, simply put the function in your working directory for Matlab. Then, you can copy the function call into the main Matlab interface. Note that you cannot run a function by itself; you must call it from another script.

function Folding_Curve(iterations,makeVideo,xlimVals,ylimVals,pattern)
% This function draws a Dragon Curve (or a variant of that curve) with the
% following inputs:
% iterations = int; number of iterations
% makeVideo = 1 or 0; set to 1 to make a video
% xlimVals = [xmin,xmax]; set the x-boundaries for the graph
% ylimVlas = [ymin,ymax]; set the y-boundaries for the graph
% pattern = pattern of 1's and 0's. For each 0, the pattern will turn
% right. For each 1 the pattern will turn left. When the pattern reaches
% the end, it will repeat. For example, [0,1] will generate the standard
% dragon curve
% If making a video, initialize the video object
if makeVideo==1
writerObj = VideoWriter('foldingCurveVideo.mp4','MPEG-4');
writerObj.FrameRate = 1;
writerObj.Quality=100;
open(writerObj)
end
angle=45;
pts=[-.5,0;.5,0];
len=1;
% Initialize the figure
fig1=figure('Position',[50,50,900,900],'Color',[1 1 1]);
c=[1/size(pts,1) 0 1-1/size(pts,1)];
% Draw the initial line
plot([-0.5 0.5],[0 0],'Color',c,'LineWidth',.75)
hold on
xlim(xlimVals);
ylim(ylimVals);
axis off
% If making a video, grab a frame
if makeVideo==1
frame = getframe(1);
writeVideo(writerObj, frame)
pause(1)
end
% Repeat for the given number of iterations
for i=1:iterations
disp(i)
cla
len=0.5*len/cosd(angle);
temp=[];
dir=1;
% Repeast for each line segment in the curve
for j=1:size(pts,1)-1
% Grab the two endpoints of the curve
pt1=pts(j,:);
pt2=pts(j+1,:);
% Subtract one endpoint from the other so you're centered on
% zero and can more easily calculate the angle
pt2corr=pt2-pt1;
if 0>=pt2corr(1) && 0>=pt2corr(2)
theta=atand(abs(pt2corr(2)/pt2corr(1)))+180;
elseif 0>=pt2corr(1)
theta=180-atand(abs(pt2corr(2)/pt2corr(1)));
elseif 0>=pt2corr(2)
theta=360-atand(abs(pt2corr(2)/pt2corr(1)));
else
theta=atand(abs(pt2corr(2)/pt2corr(1)));
end
% Determine the new point (the 'midpoint') for your line segment
if pattern(dir)==0 % If turning RIGHT
midpt=[len*cosd(theta-angle)+pt1(1),len*sind(theta-angle)+pt1(2)];
else % If turning LEFT
midpt=[len*cosd(theta+angle)+pt1(1),len*sind(theta+angle)+pt1(2)];
end
% Determine the color based on the current iteration
c=[j/size(pts,1) 0 1-j/size(pts,1)];
% Plot the new line segments
plot([pt1(1),midpt(1),pt2(1)],[pt1(2),midpt(2),pt2(2)],'Color',c,'LineWidth',.75)
hold on
xlim(xlimVals);
ylim(ylimVals);
axis off
% Add the new points to the temp variable
temp=[temp;pt1;midpt];
% Change direction based on the pattern
if dir==length(pattern)
dir=1;
else
dir=dir+1;
end
end
temp=[temp;pts(end,:)];
pts=temp;
% If making a video, grab a frame
if makeVideo==1
frame = getframe(1);
writeVideo(writerObj, frame)
end
pause(1)
end
% If making a video, grab a few frames of the final video and close the
% video object
if makeVideo==1
for i=1:5
frame = getframe(1);
writeVideo(writerObj, frame)
end
close(writerObj)
end
end
Tiling Code
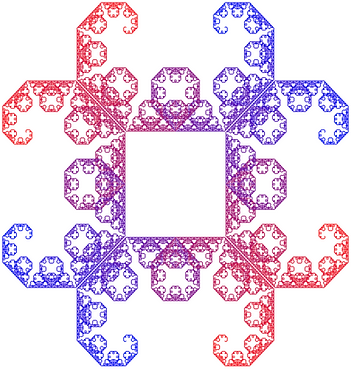
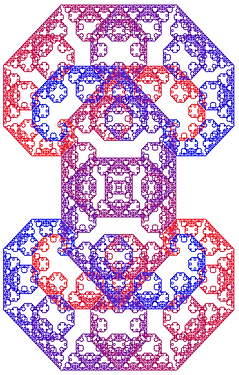
In addition to making the base Levy C curve, you can also make interesting patterns by tiling the curve. Let's say we start with 4 lines instead of 1, and they all form Levy C curves. What if the lines are arranged in a square? What if two of the sides fold in the opposite direction (i.e. always fold left instead of always folding right)? What I've done in the function Folding_Curve_4lines is provide you the opportunity to explore these possibilities.

The one major difference with this function is that it has a "shape" input. This basically just defines how the four lines are arranged. If shape = 1, you start with a square. When the Levy C curves develop, you'll note that two adjacent sides will fold IN and two other sides will fold OUT. If shape = 2, you also start with a square. But in this case two opposite sides will fold IN and the other two will fold OUT. If shape = 3, you start with a square but the lines are separated by some distance. All the lines will fold IN. If shape = 4, you start with a square but the lines all fold the same direction: IN.
Note that changing the pattern from [1] to [0] will simply reverse the orientation of the curves. Essentially, it tells the curves to turn RIGHT always instead of LEFT always.
function Folding_Curve_4lines(iterations,makeVideo,xlimVals,ylimVals,pattern,shape,filename)
% This function draws a Dragon Curve (or a variant of that curve) with the
% following inputs:
% iterations = int; number of iterations
% makeVideo = 1 or 0; set to 1 to make a video
% xlimVals = [xmin,xmax]; set the x-boundaries for the graph
% ylimVlas = [ymin,ymax]; set the y-boundaries for the graph
% pattern = pattern of 1's and 0's. For each 0, the pattern will turn
% right. For each 1 the pattern will turn left. When the pattern reaches
% the end, it will repeat. For example, [0,1] will generate the standard
% dragon curve
% shape = 1,2,3,or 4
% 1 -> square where two adjacent sides fold in, the others fold out
% 2 -> square where two opposite sides fold in, the others fold out
% 3 -> 4 lines that are separated by some distance
% 4 -> square where all sides fold in
% filename = name of file if creating a video
% If making a video, initialize the video object
if makeVideo==1
writerObj = VideoWriter([filename,'.mp4'],'MPEG-4'); % Name it.
writerObj.FrameRate = 1;
writerObj.Quality=100;
open(writerObj)
end
angle=45;
if shape==1
pts=[-1,1;1,1];
pts2=[-1,-1;1,-1];
pts3=[-1,-1;-1,1];
pts4=[1,-1;1,1];
elseif shape==2
pts=[1,1;-1,1];
pts2=[-1,-1;1,-1];
pts3=[-1,-1;-1,1];
pts4=[1,1;1,-1];
elseif shape==3
pts=[1,3;-1,3];
pts2=[-1,-3;1,-3];
pts3=[3,-1;3,1];
pts4=[-3,1;-3,-1];
elseif shape==4
pts=[1,1;-1,1];
pts2=[-1,-1;1,-1];
pts3=[1,-1;1,1];
pts4=[-1,1;-1,-1];
end
len=2;
% Initialize the figure
fig1=figure('Position',[50,50,900,900],'Color',[1 1 1]);
c4=[0,0,0];
% Draw the initial lines
plot(pts(:,1),pts(:,2),'Color',c4,'LineWidth',.75)
hold on
plot(pts2(:,1),pts2(:,2),'Color',c4,'LineWidth',.75)
plot(pts3(:,1),pts3(:,2),'Color',c4,'LineWidth',.75)
plot(pts4(:,1),pts4(:,2),'Color',c4,'LineWidth',.75)
xlim(xlimVals);
ylim(ylimVals);
axis off
pause(1)
% If making a video, grab a frame
if makeVideo==1
frame = getframe(1);
writeVideo(writerObj, frame)
pause(1)
end
% Repeat for the given number of iterations
for i=1:iterations
disp(i)
cla
len=0.5*len/cosd(angle);
temp=[];
temp2=[];
temp3=[];
temp4=[];
dir=1;
% Repeast for each line segment in the curve
for j=1:size(pts,1)-1
% Determine the color
c=[j/size(pts,1) 0 1-j/size(pts,1)];
c2=[1-j/size(pts,1) 0 j/size(pts,1)];
% Grab the two endpoints of the curve
pt1=pts(j,:);
pt2=pts(j+1,:);
pt12=pts2(j,:);
pt22=pts2(j+1,:);
pt13=pts3(j,:);
pt23=pts3(j+1,:);
pt14=pts4(j,:);
pt24=pts4(j+1,:);
% Subtract one endpoint from the other so you're centered on
% zero and can more easily calculate the angle
pt2corr=pt2-pt1;
% Calculate the new angle
if 0>=pt2corr(1) && 0>=pt2corr(2)
theta=atand(abs(pt2corr(2)/pt2corr(1)))+180;
elseif 0>=pt2corr(1)
theta=180-atand(abs(pt2corr(2)/pt2corr(1)));
elseif 0>=pt2corr(2)
theta=360-atand(abs(pt2corr(2)/pt2corr(1)));
else
theta=atand(abs(pt2corr(2)/pt2corr(1)));
end
pt2corr2=pt22-pt12;
if 0>=pt2corr2(1) && 0>=pt2corr2(2)
theta2=atand(abs(pt2corr2(2)/pt2corr2(1)))+180;
elseif 0>=pt2corr2(1)
theta2=180-atand(abs(pt2corr2(2)/pt2corr2(1)));
elseif 0>=pt2corr2(2)
theta2=360-atand(abs(pt2corr2(2)/pt2corr2(1)));
else
theta2=atand(abs(pt2corr2(2)/pt2corr2(1)));
end
pt2corr3=pt23-pt13;
if 0>=pt2corr3(1) && 0>=pt2corr3(2)
theta3=atand(abs(pt2corr3(2)/pt2corr3(1)))+180;
elseif 0>=pt2corr3(1)
theta3=180-atand(abs(pt2corr3(2)/pt2corr3(1)));
elseif 0>=pt2corr3(2)
theta3=360-atand(abs(pt2corr3(2)/pt2corr3(1)));
else
theta3=atand(abs(pt2corr3(2)/pt2corr3(1)));
end
pt2corr4=pt24-pt14;
if 0>=pt2corr4(1) && 0>=pt2corr4(2)
theta4=atand(abs(pt2corr4(2)/pt2corr4(1)))+180;
elseif 0>=pt2corr4(1)
theta4=180-atand(abs(pt2corr4(2)/pt2corr4(1)));
elseif 0>=pt2corr4(2)
theta4=360-atand(abs(pt2corr4(2)/pt2corr4(1)));
else
theta4=atand(abs(pt2corr4(2)/pt2corr4(1)));
end
% Determine the new point (the 'midpoint') for your line segment
if pattern(dir)==0 % If turning RIGHT
midpt=[len*cosd(theta-angle)+pt1(1),len*sind(theta-angle)+pt1(2)];
else % If turning LEFT
midpt=[len*cosd(theta+angle)+pt1(1),len*sind(theta+angle)+pt1(2)];
end
if pattern(dir)==0 % If turning RIGHT
midpt2=[len*cosd(theta2-angle)+pt12(1),len*sind(theta2-angle)+pt12(2)];
else % If turning LEFT
midpt2=[len*cosd(theta2+angle)+pt12(1),len*sind(theta2+angle)+pt12(2)];
end
if pattern(dir)==0 % If turning RIGHT
midpt3=[len*cosd(theta3-angle)+pt13(1),len*sind(theta3-angle)+pt13(2)];
else % If turning LEFT
midpt3=[len*cosd(theta3+angle)+pt13(1),len*sind(theta3+angle)+pt13(2)];
end
if pattern(dir)==0 % If turning RIGHT
midpt4=[len*cosd(theta4-angle)+pt14(1),len*sind(theta4-angle)+pt14(2)];
else % If turning LEFT
midpt4=[len*cosd(theta4+angle)+pt14(1),len*sind(theta4+angle)+pt14(2)];
end
% Determine the color based on the current iteration
%c=[j/size(pts,1) 0 1-j/size(pts,1)];
% Plot the new line segments
plot([pt1(1),midpt(1),pt2(1)],[pt1(2),midpt(2),pt2(2)],'Color',c,'LineWidth',.75)
hold on
plot([pt12(1),midpt2(1),pt22(1)],[pt12(2),midpt2(2),pt22(2)],'Color',c,'LineWidth',.75)
plot([pt13(1),midpt3(1),pt23(1)],[pt13(2),midpt3(2),pt23(2)],'Color',c2,'LineWidth',.75)
plot([pt14(1),midpt4(1),pt24(1)],[pt14(2),midpt4(2),pt24(2)],'Color',c2,'LineWidth',.75)
xlim(xlimVals);
ylim(ylimVals);
axis off
% Add the new points to the temp variable
temp=[temp;pt1;midpt];
temp2=[temp2;pt12;midpt2];
temp3=[temp3;pt13;midpt3];
temp4=[temp4;pt14;midpt4];
% Change direction based on the pattern
if dir==length(pattern)
dir=1;
else
dir=dir+1;
end
end
temp=[temp;pts(end,:)];
pts=temp;
temp2=[temp2;pts2(end,:)];
pts2=temp2;
temp3=[temp3;pts3(end,:)];
pts3=temp3;
temp4=[temp4;pts4(end,:)];
pts4=temp4;
% If making a video, grab a frame
if makeVideo==1
frame = getframe(1);
writeVideo(writerObj, frame)
end
pause(1)
end
% If making a video, grab a few frames of the final video and close the
% video object
if makeVideo==1
for i=1:5
frame = getframe(1);
writeVideo(writerObj, frame)
end
close(writerObj)
end
% Save the final iteration as an image
saveas(fig1,[filename,'.png']);
end
Tiling Examples
Here you will find use cases of the Folding_Curve_4lines function!
Folding_Curve_4lines(14,0,[-3.5,3.5],[-3.5,3.5],[1],4,'filename1')
Folding_Curve_4lines(14,0,[-3.5,3.5],[-3.5,3.5],[1],1,'filename1')


Folding_Curve_4lines(14,0,[-3.5,3.5],[-3.5,3.5],[1],3,'filename1') Folding_Curve_4lines(14,0,[-3.5,3.5],[-3.5,3.5],[0],2,'filename1')