Julia Sets
Background
Remember that a complex number is one that has a real part and an imaginary part, typically written in the form a + b*i, where a is the real part and b is the imaginary part.

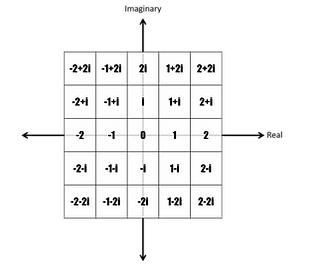
Now let's look at a two-dimensional coordinate system, where real numbers (a) are along the x-axis and imaginary numbers (b) are along the y-axis. Thus, every point in this plane is a complex number with an x-value of a and a y-value of b.
Let's say that both the x and y-axes go from -2 to 2.
Okay, now let's take this coordinate system and make it a matrix. Basically, we are creating bins at a desired resolution to capture the two-dimensional coordinate system we just discussed. For example, if we set our binsize to be 1 (or our resolution to be 5), we'd get the matrix pictured to the right.
From a practical perspective, we'll want a much greater resolution, say 500, for computing Julia Sets.
The basic Julia Set works like this: for each point in the matrix we just defined, you take the entry, square it, and add some complex number C. You repeat this process of squaring and adding C for a given number of iterations. Here, C can be any complex number (a + b*i), where a and b vary between –1 and 1.
After each iteration, you essentially ask if the value diverges (simplistically, if the value is >10 or something like that). If it does, you note the index at which the divergence happened in an output matrix. After you finish iterating, you can view the output matrix as a heatmap. It turns out that simply varying the value of C is sufficient to create a huge array of interesting designs!
Code
function juliaSet(r,w,inc)
% Draws a julia set with iterations r and resolution w. Inc determines
% the factor c you add to the julia set at each iteration. repeatColors
% should be set to 1 if you want the colors to cycle back through black
% partway through the drawing
% Create the real and imaginary parts of each number in a temporary
% variable
temp=zeros(w,w,2);
for i=1:w
temp(i,:,1)=linspace(-2,2,w);
temp(:,i,2)=linspace(-1.5,1.5,w);
end
% Set the initial values based on their real and imaginary components
values=zeros(w,w);
for i=1:w
for j=1:w
values(i,j)=temp(i,j,1)+1i*temp(i,j,2);
end
end
% Initialize the output
output=zeros(w,w);
% For each iteration, cycle through data and perform the desired
% computatation
for i=1:r
for m=1:w
for k=1:w
values(m,k)=(values(m,k))^2+inc;
% Essentially, set output(m,k) equal to the current
% iteration if the series diverges
if abs(values(m,k))>10 && output(m,k)==0
output(m,k)=i;
end
end
end
if i==r
for m=1:w
for k=1:w
if output(m,k)==0
output(m,k)=i;
end
end
end
end
end
% Create the figure
figure('Position',[50,50,750,500],'Color',[1,1,1]);
imagesc(output(:,:));
colormap('hot');
axis off
end
Examples
In the examples shown below, the animated gif shows the heatmap of divergence for a number of different iterations.
c = −0.8i


c = 0.285 + 0.01i


c = −0.835 − 0.2321i


Other options
You can also do operations other than squaring the entry with each iteration! Here are some examples of other operations.
values(m,k) = cos((values(m,k))^2)+(inc) c = −0.8i
values(m,k) = sin((values(m,k))^2)+(inc) c = −0.8i


values(m,k)=sin((values(m,k))^6)+(inc); c = −0.8i
